The Michigan Department of Corrections released its 2017 Statistical Report on Jan. 23, 2019. It releases statistical reports annually, and each year they contain hundreds of pages of facts, figures, charts and tables that help paint the picture of Michigan’s criminal justice system. The information covers topics such as how many people are newly sentenced to prison each year; how many people are incarcerated in state prisons and for which offenses; the average length of stays by offense types, such as assaultive or non-assaultive offenses, or drug violations; trends in incarceration by race, age and gender; recidivism rates; and information on the felony probation population and the parole population.
Wading through a statistics-laden 285-page document can be intimidating. That’s why Safe & Just Michigan will dedicate a series of blog posts to highlight some of the more interesting findings in this year’s Michigan Department of Corrections statistical report.
While it may seem like numbers from the end of 2017 are too old to be useful, it takes a lot of time to compile all the data gathered by the department into one useable document, and these are the most recent numbers available. There are also data items that MDOC doesn’t report that we wish it did. For instance, the department breaks down demographics of people who are incarcerated by race into “white” and “non-white,” making it unclear exactly how many black, Hispanic, Asian or other people are incarcerated, and whether they are being overrepresented in the prison population, or whether they are receiving longer sentences than other groups of people.
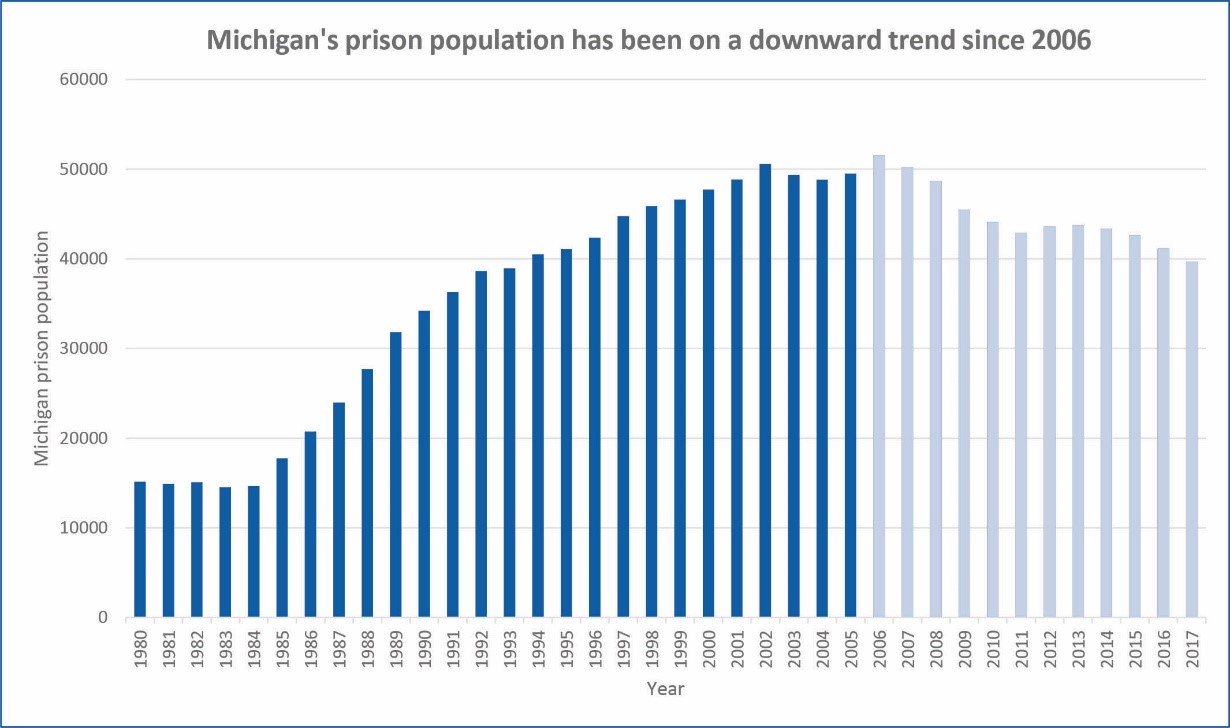
One of the most watched numbers to come from these reports is the prison population figure. This time around, that figure was already known. The MDOC had already reported that figure — 39,666 — in the middle of 2018. That number is notable because it represented the first time since 1993 that Michigan had fewer than 40,000 people in prison. We reached our highest prison population in 2006, when there were 51,515 people incarcerated in our state, and that number has been steadily dropping ever since.

Even though there’s no requirement that the Michigan Department of Corrections prepare this report on an annual basis, but it can be useful in many ways.
First, figures in the report illuminate how taxpayer dollars are being spent by the Michigan Department of Corrections. For instance, within the report are statistics that describe how much the department is spending on health care per each incarcerated person, and how much is spent at each of its 31 prisons and the Special Alternative Incarceration (boot camp) facility, as well as the overall sums spent by the department on community corrections, information technology, central office administration and other items.
Just as importantly, the statistics within shed light on how effective — or ineffective — corrections policies are working in Michigan. For example, one chart shows that a quarter of all people on probation in Michigan ultimately end up being sentenced to prison. This shows that there is room for improvement in the state’s community corrections program. Lawmakers could attempt to draft legislation to address this, or organizations interested in criminal justice reform could use this information to search for solutions.
These reports are also important because you — as members of the public — have a right to know how the state is spending your tax money and what is happening inside our prisons. Whether or not you know someone inside prison, we all have a stake in how these facilities are operated and how the people who live there are treated. About four in every five incarcerated people will ultimately be released to go home, so everyone has a stake in criminal justice, reform and restoration.
That’s why Safe & Just Michigan will be devoting nine blog posts to take a deeper dive into the 2017 Statistical Report to relate some of the more important and interesting findings to you. Check back soon!